Last week, one of our maintenance jobs on one of our servers failed. This was not a big deal. We got an alert via slack message and fixed the issue in no time. But it raised more questions.
The job failed due to insufficient space left on disk. But how is this even possible? We monitor the vital metrics of our servers and should have gotten a disk pressure alert. Apparently something went wrong. So, we dug into it.
First, a very brief wrap up about our monitoring infrastructure: We have different servers of our own. We rent physical hosts and virtual machines in a data center. But beside that, we manage them ourselves for learning purposes and because we value the high level of customization, which is possible. Those servers report vital metrics like disk pressure, RAM pressure, RAID status via Vector to a central Vector instance, which then delivers the data to an Grafana instance.
In Grafana we have a lot of dashboards, but mainly we use alerting via slack notifications to raise our attention to issues. From the perspective of Grafana, there's only one vector instance reporting to it. We label the metrics with the hostname and such.
It turned out that two of our servers just stopped reporting metrics. Hence, no disk pressure alert was triggered. So what to do? What we want is very clear. We want the servers to always deliver metrics and receive an alert if a server stops to do so, but:
- We do not want to take care of a list of servers in Grafana. We change our infrastructure rather often, so the alerting needs to be flexible and self-healing.
- We cannot use up since the label of interest is not attached to this metric.
- The alert must tolerate that different hosts send metrics in different intervals.
- The alert must tolerate us working on one instance such that it skips one or two intervals.
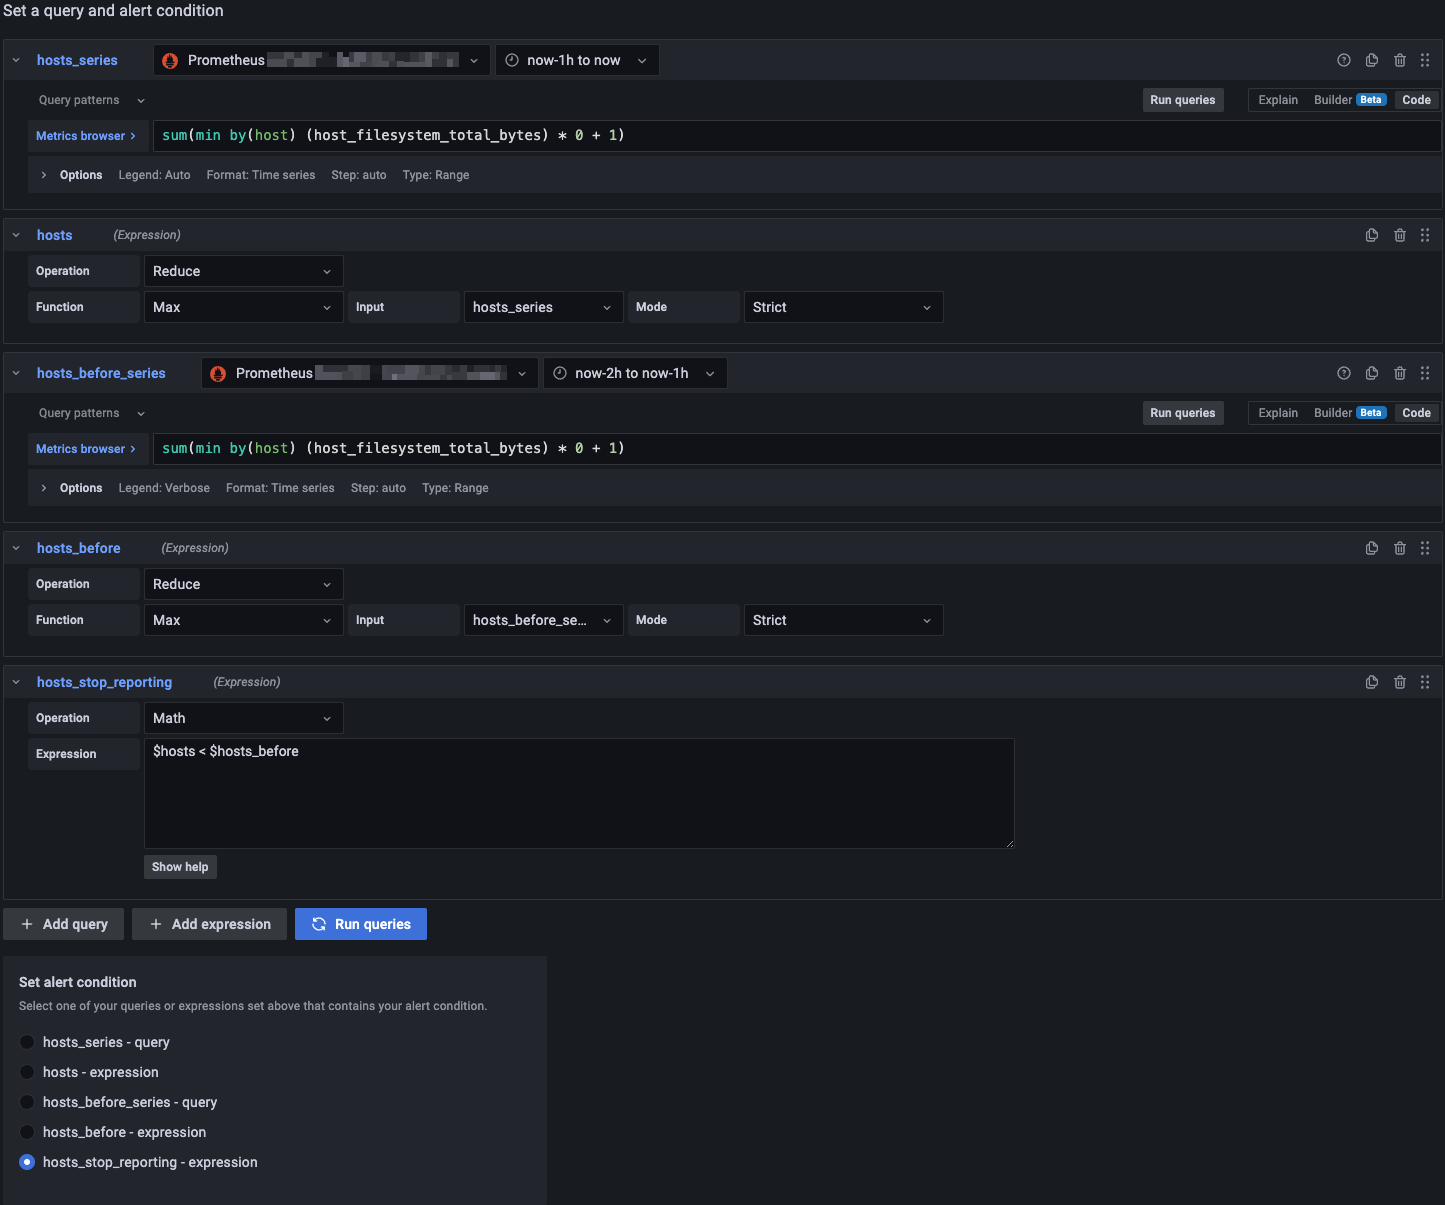
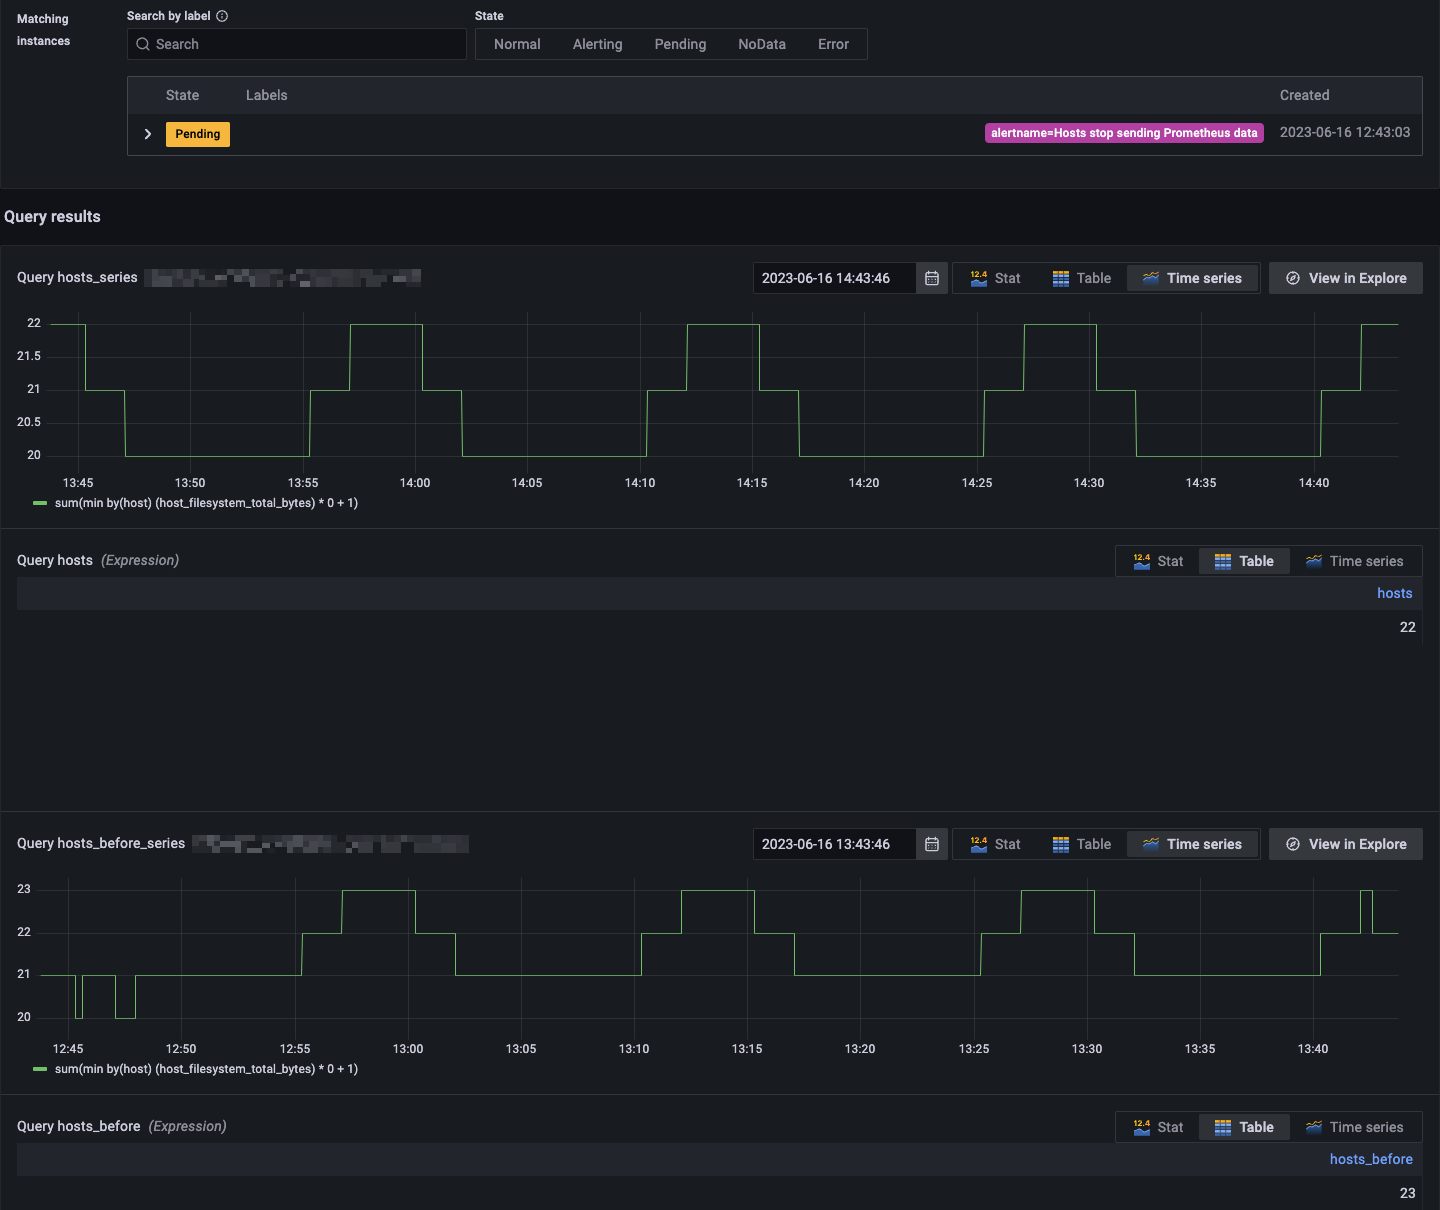
In a nutshell, the alert works as follows: we want to get an alert whenever the number of host labels for a representing metric in the last hour is less than in the hour before.
Then we would notice if a server stops sending data, we would not need to configure anything in Grafana whenever we add some servers. In the case we remove a server, we would just ignore the alert and after one hour, the alert would become green by its own again. Of course, this is a trade-off. If you can ignore alerts, that is not always a good thing. But in this case, it is probably sufficient.
In the following, I share the alert configuration. Feel free top copy from it.


